Undergraduate
STEP 1: ask the students to draw graph for the milk market.
Now, how does the market change as a result of International Milk’s activity? In particular, if milk is poured down the drain, answer the the following:
Which curve shifts?
Which direction does it shift?
What happens to price and quantity?
Answers:
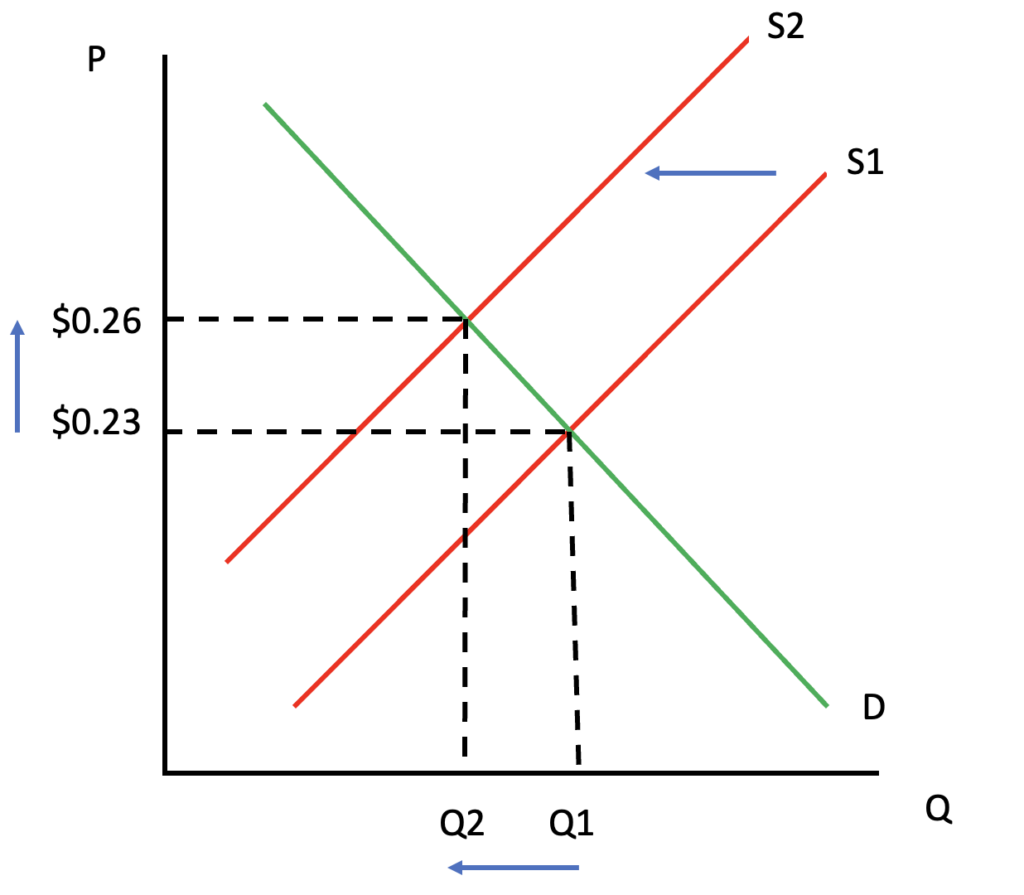
The supply curve shifts.
It shifts to the left, because supply falls.
The new price is higher and the new market quantity is lower.
The figure below shows the market as International engages in market manipulation. The original equilibrium is a quantity of Q1 and a price of $0.23. The new equilibrium occurs at a lower quantity, Q2, and a higher price of $0.26. (NOTE: The price of $0.26 is mentioned in the comic. Any price lower than this is acceptable for the original market price.) The key result for students to understand is that when supply falls, the price rises.

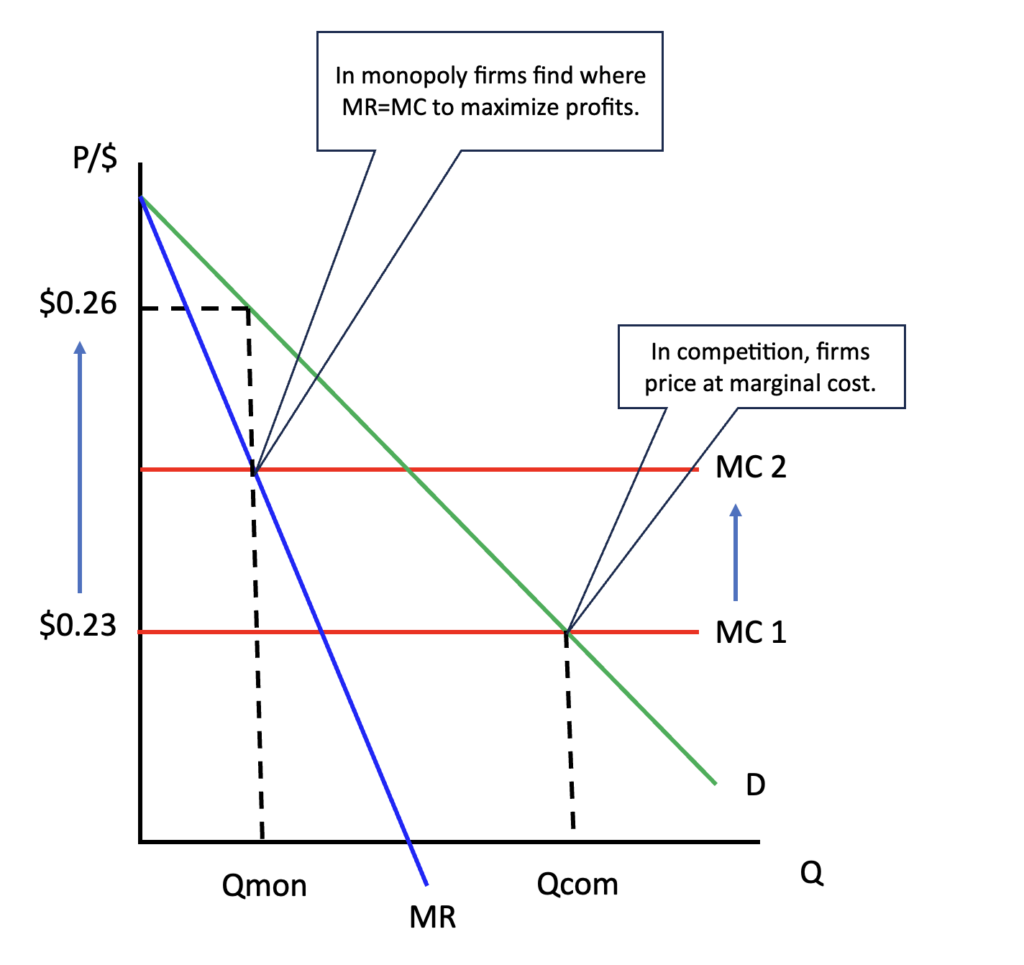
STEP 2: Alfonso de Gyppo, President of International Milk, tries to explain his dilemma to Wonder Woman. His costs are very high as he tries to buy up the milk (clearly admitting to a violation of anti-trust laws). To analyze International Milk’s monopoly, have students draw a graph to represent this situation. Ask them to show what happens as the marginal costs of production increase due to the higher price International Milk pays to buy up the supply. Show how this leads to higher market prices and lower quantities for milk relative to the competitive market. A version of this graph is shown below:
NOTE: The marginal cost curve is flat to simplify the exposition. The competitive result occurs where MC = D. This is is where firms are pricing at marginal cost. The output where P = MC is the competitive output – Qcom. The price of $0.26 is mentioned in the comic and is used for the monopoly price. Any price lower than this is acceptable for the competitive market. When the marginal cost rises and International Milk achieves it’s monopoly position, it uses the profit maximizing rule of MC= MR. From there, drop down to the quantity axis to find the lower monopoly output – Qmon. The $0.26 monopoly price is found by going up to the demand curve and over to the price axis.
Make sure students explain what is in their graph in a few sentences. Drawing the graph is a nice skill, but to make sure students know what they are doing and not just reproducing something they find in a book or online, they should be able to offer a written explanation.


